
Your whole account, at a glance.
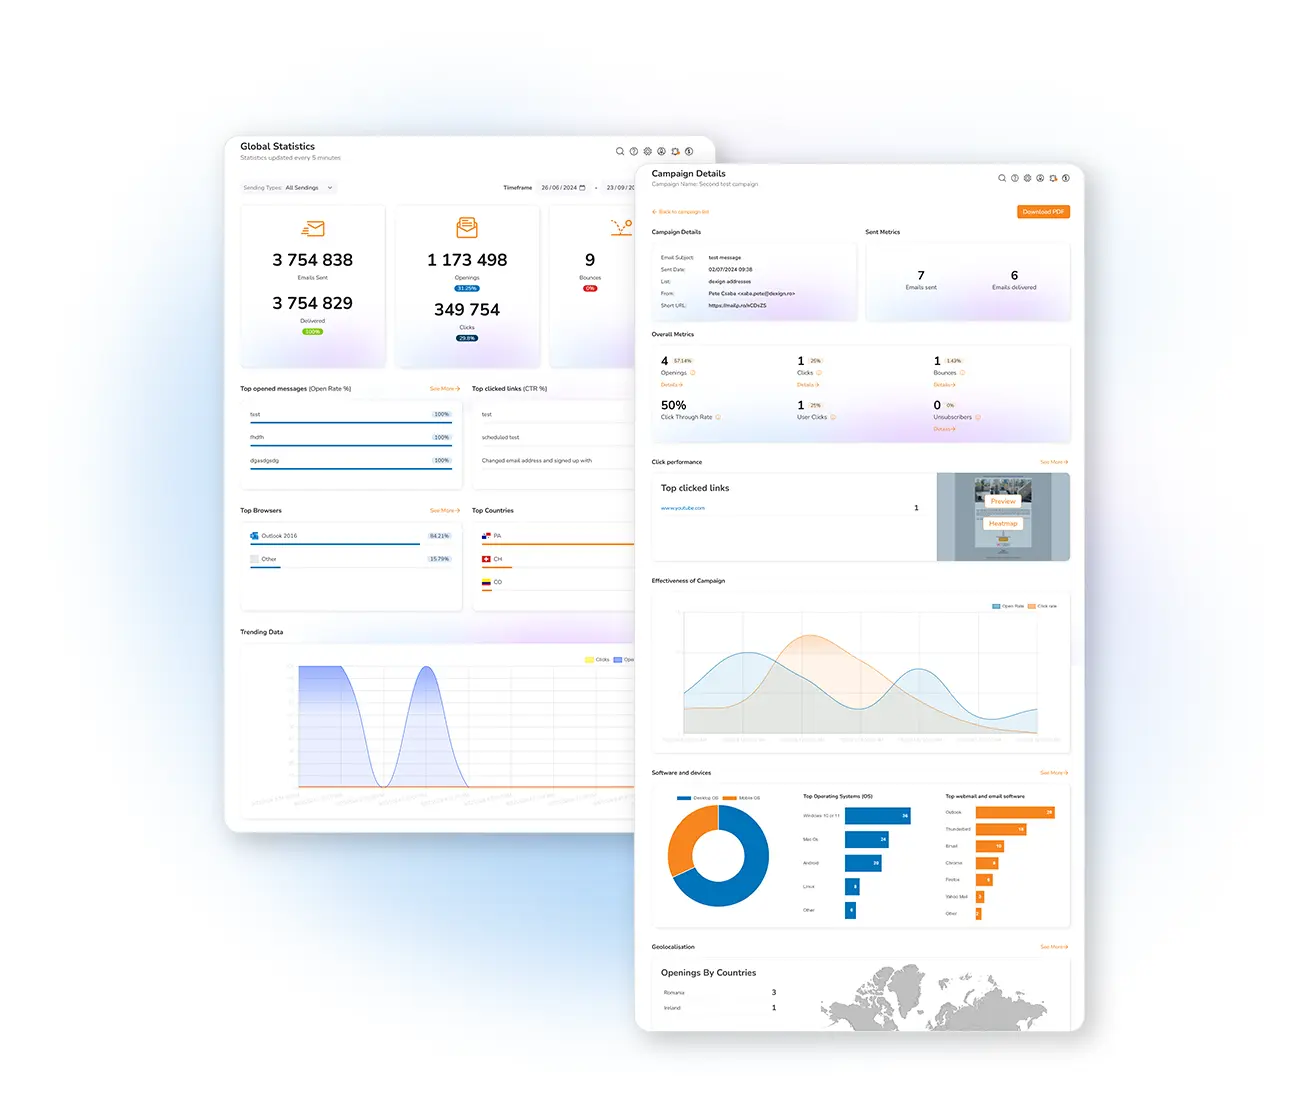
The general statistics give you a complete, accurate summary of your data from your first delivery to your last — in real time. One look reveals the behaviour of all your campaigns, where you fell short, and how to improve the next send.
A complete summary in real time
Within the general statistics you'll find an accurate summary of your data from the first delivery to the last. These numbers show, in real time, the behaviour of all your campaigns — so you can study and fully understand how your past and current email marketing is performing. The precise measurement of each campaign reveals where you failed and how to improve the sends to come.
See all data from your first campaign to the most recent using the time-period box in the top-right of your statistics screen: current week, last 14 days, current and past month, or "all time." Ran a campaign around Christmas or New Year? Use the custom range to zoom in on exactly those days.
The numbers that summarize everything
Don't skim any metric — try every option and fully analyze your email statistics. Read more in our email marketing metrics guide.
Frequently asked questions
What do the general statistics show?
Can I filter by date?
See the big picture of your email marketing
Start free and get a real-time overview of every campaign you send.